
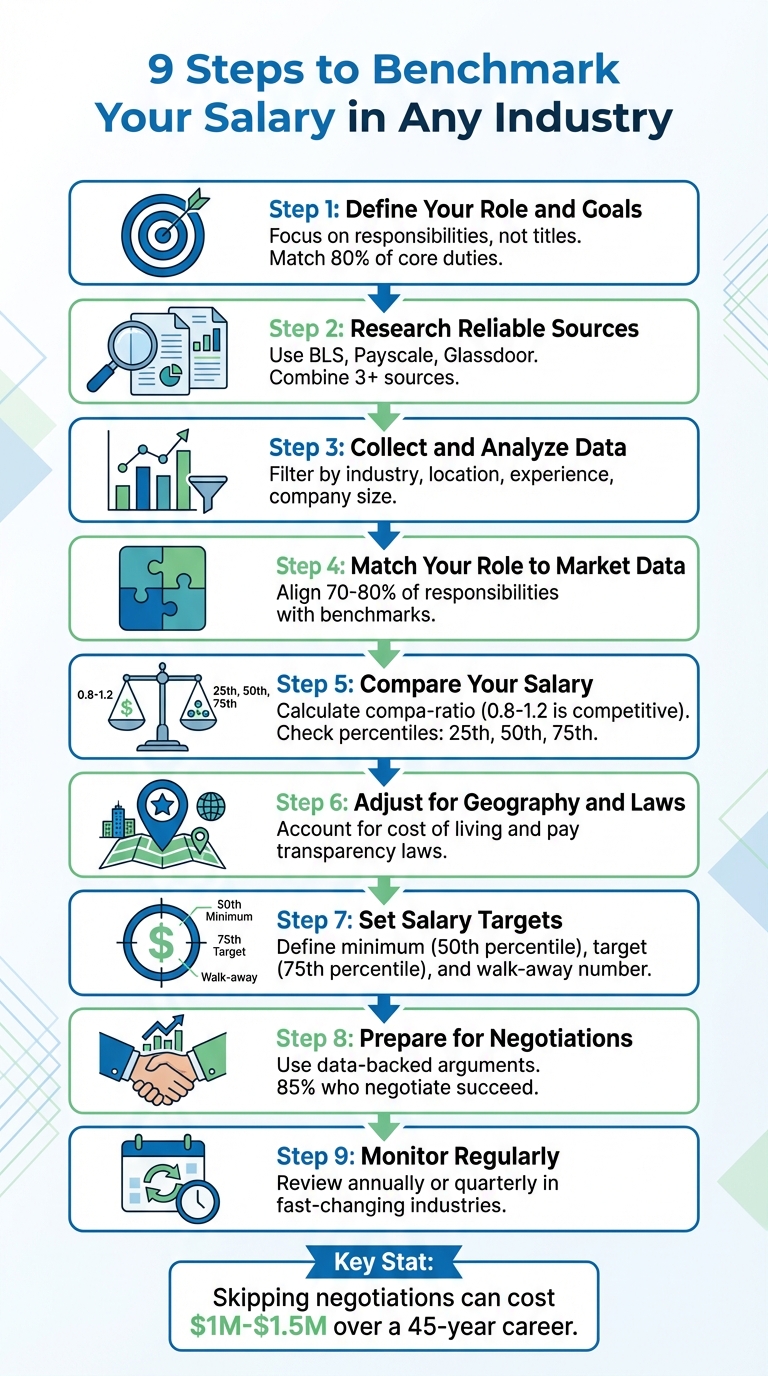
Salary benchmarking helps you compare your pay to market standards, ensuring you understand your worth and make informed decisions. Use these 9 steps to evaluate your salary effectively:
- Define Your Role and Goals: Focus on responsibilities, not just job titles. Set clear compensation goals based on your career stage.
- Research Reliable Sources: Use platforms like the U.S. Bureau of Labor Statistics (BLS), Payscale, and Glassdoor for accurate salary data.
- Collect and Analyze Data: Filter salary information by industry, location, experience, and company size.
- Match Your Role to Market Data: Align your responsibilities with benchmarks, considering hybrid roles or specialized skills.
- Compare Your Salary: Use percentile data (25th, 50th, 75th) and calculate your compa-ratio to see where you stand.
- Adjust for Geography and Laws: Account for cost-of-living differences and pay transparency regulations.
- Set Salary Targets: Establish a range with a minimum, midpoint, and maximum based on your market research and financial needs. You can also track your expenses to better understand your current spending habits.
- Prepare for Negotiations: Use data-backed arguments and practice your pitch to secure better pay or perks.
- Monitor Regularly: Review salary benchmarks annually or quarterly, especially in fast-changing industries.
9-Step Salary Benchmarking Process Flowchart
Step 1: Define Your Role and Goals
Start by pinpointing your role and setting clear goals for benchmarking. This step ensures you're making accurate comparisons when evaluating market rates.
Outline Your Job Role
Begin by detailing your responsibilities, tools you use, decision-making authority, and level of experience. Job titles like "Marketing Manager" or "Software Engineer" can vary widely between companies. For example, a "Senior Analyst" in one organization might focus on strategic planning, while in another, the role might be strictly about reporting.
It's better to focus on what your job entails rather than just the title. Identify your job family (e.g., Finance, Marketing, Engineering) and your career level (e.g., Junior, Senior, Director). Also, clarify whether you're part of a team or working independently.
"A person is not their job... match based off the job description - the skills, duties, and competencies of the jobs at hand." - Salary.com
When comparing your role to market data, look for benchmarks that align with at least 80% of your core responsibilities. If your job combines multiple functions - like 60% Data Analyst and 40% Product Owner - research rates for both roles and either create a weighted average or benchmark against the higher-level role.
Also, make a note of any specialized skills or certifications you have. These can significantly impact compensation, especially in tech-driven roles, and will be critical in later benchmarking steps.
Once you've outlined your role, focus on how benchmarking ties into your compensation goals.
Set Your Compensation Goals
Decide whether you're negotiating a raise, reviewing a job offer, or planning a career shift. Each scenario requires a different approach to market data. For example, if you're negotiating, you might aim for the 75th percentile of market pay for high-demand roles. If you're relocating, consider how cost-of-living changes will affect your purchasing power.
"A clear, documented process solves these problems by anchoring every pay decision in current market trends and defensible methodology." - SalaryCube
sbb-itb-02fd20a
Step 2: Research Reliable Salary Data Sources
Once you’ve defined your role and goals, the next step is gathering accurate market data. The quality of your salary benchmarking depends heavily on the reliability of your sources, so it’s crucial to focus on platforms that offer current, verified information.
Explore Free and Paid Resources
A great starting point is the U.S. Bureau of Labor Statistics (BLS). Their Occupational Employment and Wage Statistics (OEWS) program covers wage data for around 830 occupations across 400 industries. The BLS provides detailed hourly and annual wage estimates broken down by percentiles (10th, 25th, 50th [median], 75th, and 90th). This breakdown helps you understand where you might fit within the salary range. For instance, entry-level professionals may aim for the 10th–25th percentiles, while seasoned experts often fall within the 75th–90th range.
For more tailored insights, Payscale is another excellent resource. It pulls data from over 100,000 job titles and around 40 million salary profiles [8,22]. Payscale’s reports are customized based on factors like your skills, education, and location, and its database updates daily to reflect current trends. Similarly, Glassdoor offers salary estimates for over 900,000 companies based on anonymous employee submissions, while Salary.com is recognized for its clear data sourcing and analysis.
"Experts recommend searching by job description, instead of job title, and using data from at least three sources for the best results." - Payscale
When comparing roles, it’s important to filter data by industry, geography, and company size rather than relying solely on job titles. For example, in May 2024, Computer Systems Analysts in aerospace manufacturing earned an average annual salary of $133,510, while those working in colleges and universities earned $93,310. If you’re considering a move to a new city, tools like Payscale’s Cost-of-Living Calculator can help you adjust your salary expectations. For instance, wages in cities like San Francisco are typically higher to account for increased living expenses [5,20].
Beyond base salaries, credible sources also provide insights into bonuses, benefits, and total compensation packages. While government surveys like those from the BLS offer a broad and authoritative perspective, keep in mind that their data may be up to a year old. Crowdsourced platforms, on the other hand, update more frequently based on voluntary submissions. Combining these external data points with your own earnings records ensures you have a comprehensive view of salary trends.
Track Your Income with Monefy

While external platforms provide market benchmarks, tracking your own earnings helps you monitor your personal salary progression. Apps like Monefy allow you to record and review your income over time, including salary changes, bonuses, and other forms of compensation. This creates a clear picture of your financial growth and how it aligns with market trends.
"What your skills are worth in the job market is constantly changing"
Step 3: Collect and Analyze Market Salary Data
Once you've identified reliable sources, the next step is to gather and carefully analyze salary data. To get a clear and accurate picture, aim to pull information from at least three different sources. Using multiple datasets helps reduce the risk of relying on outdated or biased information.
Filter Salary Data by Key Factors
Raw salary data is just a starting point. To make it meaningful, you need to filter it based on specific role requirements, industry, location, and experience level. Instead of focusing solely on job titles, prioritize job responsibilities to ensure the data aligns with the actual role.
For example:
- Industry: Salaries for the same role can vary widely across industries.
- Geography: Location plays a significant role. Salary expectations in San Francisco or New York are often higher due to elevated living costs.
- Company Size: Larger organizations may offer different compensation compared to smaller firms.
- Experience Level: Entry-level salaries will naturally differ from those of seasoned professionals.
The Bureau of Labor Statistics (BLS) offers wage data for over 580 geographic areas, covering both metropolitan and non-metropolitan regions. This level of detail helps you tailor your analysis to your specific circumstances.
"The data must be specific to your industry, geography, as well as your organization's size and type, and include the variety of skill sets, experience levels and educational backgrounds." - Payscale
After filtering, look beyond just base salary to understand the full scope of compensation.
Consider Total Compensation
Focusing on base salary alone only tells part of the story. Total compensation includes additional benefits like bonuses, stock options, health insurance, retirement contributions, and more. These extras can significantly enhance the overall value of your compensation package.
For instance, the BLS Employer Costs for Employee Compensation (ECEC) survey measures the average cost employers incur for wages, salaries, and benefits combined. This data provides insights into how much value benefits add to your total package.
When analyzing salary data, take note of where you fall within the distribution. BLS data breaks down wages into percentiles - 10th, 25th, 50th (median), 75th, and 90th. If you're just starting out, you'll likely fall in the lower or middle range. Experienced professionals, on the other hand, often target the upper percentiles.
To gauge your current standing, use the compa-ratio - a simple calculation where you divide your current pay by the market midpoint. A healthy range typically falls between 0.8 and 1.2.
With your data filtered and analyzed, you're ready to align your role with the market benchmarks in the next step.
Step 4: Match Your Role to Market Data
Once you've narrowed down your data, the next step is to match your role to the market - not just by job title, but by actual responsibilities. Titles can be misleading; for instance, a "Marketing Manager" at one company might oversee a $5 million budget and lead a team of 10, while at another, they might handle social media campaigns alone. The focus here should be on job content and responsibilities, not just the label on your business card.
Categorize Your Position
Start by listing your 5 to 7 key responsibilities - the tasks that take up most of your time. Include important factors like decision-making authority, budget oversight, revenue impact, and whether you manage a team. These elements are far more relevant than how long you’ve been in the role when determining your market fit.
Use the 70-80% rule as your guide. Your role should align with at least 70% to 80% of the responsibilities in the external benchmark description. If your match falls below this range, you’re probably using the wrong comparison.
"A person is not their job, so don't try and match the capabilities of individual people who perform a job within your organization with the high-level job descriptions in salary benchmark data sets." - Connor Harrison, Salary.com
For hybrid roles, where your job combines multiple functions, you can use the blending method: benchmark each part of your role separately based on how much time you spend on it, then combine the results. Alternatively, if your role requires a specialized skill set just to qualify, consider the "highest level role" method, which prices the position based on that premium skill.
Use Benchmarking Tools
The Bureau of Labor Statistics (BLS) offers the Occupational Employment and Wage Statistics (OEWS) query system, which covers around 830 occupations. It includes detailed definitions and wage data across percentiles (10th, 25th, median, 75th, and 90th), making it a reliable resource for matching roles and accounting for varying experience levels.
For more targeted benchmarking, platforms like SalaryCube can be helpful. Their tools, such as "Job Description Studio" and "DataDive Pro", provide market-aligned job descriptions and on-demand benchmarking reports. Unlike traditional annual surveys that may be outdated by 6 to 12 months, these platforms often update data daily, giving you access to more current insights.
Document your choices as you go. Record why you selected specific benchmarks, particularly if you made adjustments for partial matches. This documentation will not only help with salary negotiations but also ensure consistency if you revisit your analysis in the future. Keep in mind that most organizations can directly benchmark only 50% to 70% of their roles, so creative approaches are often necessary. By documenting your rationale now, you'll be better prepared for upcoming salary discussions and future evaluations.
Step 5: Compare Your Salary Against Benchmarks
Once you've matched your role to market data, it's time to see how your salary stacks up against established benchmarks. Start by calculating your compa-ratio - this is your salary divided by the market median. A compa-ratio between 0.8 and 1.2 suggests you're within a competitive pay range. For example, if you earn $75,000 and the market median is $80,000, your compa-ratio is 0.94, signaling you're fairly aligned with the market.
You’ll want to reference the 25th, 50th, and 75th percentiles to pinpoint your position in the market. The 25th percentile reflects entry-level or lower-end pay, the 50th percentile is the market median (your main guide), and the 75th percentile is for top performers or those with niche expertise. For instance, as of May 2024, financial managers earned a median salary of $161,700, while software developers earned $133,080. If you're a software developer making $110,000, you're below the median - but that could make sense if you're early in your career or working at a smaller company. This type of analysis can help you walk into salary negotiations with confidence.
Don’t forget to factor in total compensation. Beyond base salary, this includes bonuses, stock options, profit-sharing, retirement contributions, and even the dollar value of benefits like health insurance and PTO.
"Knowing exactly where you stand, and why, is the first step to boosting your pay."
– Investopedia
Geography also plays a huge role. For example, a fundraising manager in Washington earns a median of $153,950, while the same role in Illinois pays $112,340 - a difference of over $41,000. If you're comparing your salary to national benchmarks but live in a region with a lower cost of living, adjust your expectations accordingly. Tools like cost-of-living calculators or location-specific filters in salary data can help you normalize these numbers. And if you’re working remotely for a company based in another state, find out whether they use geographic pay (adjusted for your location), national rates (fixed regardless of location), or a hybrid approach.
Step 6: Adjust for Geographic and Legal Factors
The value of your salary can shift dramatically depending on local costs and legal requirements. For instance, a $100,000 salary in San Francisco won't stretch nearly as far as the same amount in Des Moines. To put it into perspective, someone earning $50,000 in Des Moines would need around $96,893 in San Francisco to maintain the same standard of living. Housing alone accounts for 32.9% of average household spending in 2023, with transportation at 17% and food at 12.9%. On a broader scale, California's cost of living is 38% above the national average, while Texas and Florida are 7% and 2% lower, respectively.
To figure out what you’d need to earn in a new location, you can use this formula:
Adjusted Salary = (New City Cost Index / Current City Cost Index) × Current Salary
This calculation helps you align your salary expectations with local market conditions. Tools like the MIT Living Wage Calculator can estimate basic living costs, while the Tax Foundation offers detailed state-by-state tax insights. For example, states like Florida and Wyoming have no state income tax, while New York and California impose much heavier tax burdens. Be sure to calculate your net pay after factoring in local taxes and essential expenses, as these can significantly impact your take-home salary.
State laws also play a big role in shaping compensation practices. Pay transparency laws, for instance, are changing how salaries are benchmarked across the U.S. States such as California, Colorado, Illinois, Maryland, New York, and Washington require employers to include salary ranges in job postings. California’s rule applies to companies with 15 or more employees, while Colorado’s law extends to any employer with at least one employee. Additionally, many states have banned employers from inquiring about your salary history, ensuring offers are based on market rates rather than past earnings.
"Pay transparency is an initiative to make it easier to identify systemic pay inequities and empower job seekers and employees to demand equal pay."
– ADP Editorial Team
If you're exploring remote work, keep in mind that many state transparency laws (like those in California, Colorado, Washington, and New York) also apply to remote positions if the job can be filled by a resident of that state. This means companies posting nationwide remote roles may need to comply with multiple state regulations. Use these posted salary ranges as benchmarks during negotiations, but also consider citing specific cost-of-living data - like local rent averages or tax rates - to justify a higher salary or even request relocation assistance. For instance, in Washington, employers have a 5-business-day window to fix non-compliant job postings, a rule in place until July 27, 2027. These nuances can give you additional leverage when negotiating compensation.
Step 7: Set Your Salary Targets
Using your market research and geographic adjustments, craft a salary range that aligns with industry norms and your financial needs. A typical salary range includes three key points: the minimum (the lowest acceptable salary), the midpoint (the market median), and the maximum (the upper limit). For most professional positions, the midpoint corresponds to the 50th percentile, which represents the typical earnings of a fully qualified employee.
If you meet the basic qualifications for the role, using the market median as your baseline is a good approach. However, if you bring specialized expertise, advanced certifications, or extensive experience that adds measurable value, aim for the 75th percentile instead. Don’t forget to account for the entire compensation package, including bonuses, equity, and the cash equivalent of benefits like health insurance and retirement contributions. Keep in mind that in 2024, 46% of professionals reported receiving smaller bonuses than expected - or none at all - so relying solely on variable pay may not be the best strategy.
Prepare for Negotiations
Leverage your market analysis (from Step 5) to prepare for salary discussions. Before entering negotiations, define three key numbers: your Target (the 75th percentile you’ll request), your Minimum (the 50th percentile you’re willing to accept), and your Walk-away (the absolute lowest salary you can live with based on your financial needs). Interestingly, 85% of employers expect candidates to negotiate, yet 63% of job seekers accept the first offer without question. Among those who counter-offer, 85% successfully secure at least part of what they request. Over a 45-year career, skipping negotiations could cost you $1 million to $1.5 million in lost earnings due to the compounding effects of raises and bonuses.
Build your case with specific, data-backed points. Instead of saying, "I was hoping for more", reference credible sources like the Bureau of Labor Statistics or percentile data for your role and location. Highlight your value by quantifying achievements, such as "reduced system downtime by 15%" or "saved $340,000 in operational costs". Practice your negotiation pitch with a friend to refine your delivery and prepare for potential objections. As Mori Taheripour, a negotiations expert at Wharton School, puts it:
"If you, in fact, think about negotiations as problem-solving, then that's all it is".
Sharon Belden Castonguay, a career counselor, emphasizes:
"It's not just about your current paycheck, but your long-term earning potential".
Always wait for a written offer before starting negotiations, and address all concerns in one conversation rather than dragging it out over multiple follow-ups. If the employer insists that the base salary is non-negotiable, shift your focus to non-salary perks like signing bonuses (typically $2,000–$20,000), extra PTO (3–5 additional days), remote work options, or a faster six-month performance review.
Align Salary Goals with Personal Finances
Your salary target needs to match both market data and your personal financial situation. Use tools like Monefy to track your income and expenses, ensuring your "walk-away" number covers your essential costs.
When evaluating an offer, look at the total compensation package in the context of your budget. A lower base salary might still work if it comes with valuable perks like tuition reimbursement, childcare support, or significant equity options. Use Monefy’s budgeting features to explore different scenarios: How would accepting the median salary affect your ability to pay off debt? What financial advantages come with a 75th-percentile offer? By modeling these outcomes, you can ensure your salary targets align with your personal financial goals - not just market averages.
Step 8: Monitor and Update Regularly
Once you've set your salary targets, keeping them up-to-date is crucial to remain competitive. Salary benchmarking isn't a one-and-done task - it requires consistent monitoring and adjustments. Most organizations revisit salaries at least once a year, often aligning this process with annual compensation or merit review cycles. For individuals, this timing works well too - try aligning your benchmarking efforts with your performance review or the start of a new year.
That said, annual reviews might not always cut it. In industries that evolve quickly, like tech, quarterly reviews may be necessary. For example, salaries for tech roles like software engineers can jump by 15% to 25% in just a few months. Ravio highlights the importance of this ongoing approach:
"Salary benchmarking isn't a one-time exercise. It's an ongoing practice that keeps your compensation competitive, defensible, and aligned with your business strategy".
To stay on top of these changes, document every salary adjustment and update your benchmarks as needed. Use personal finance tools to track your total compensation - including bonuses, equity, and benefits - against these benchmarks. Keeping a detailed record of your income timeline will help you see if you're staying in step with market trends or lagging behind.
For critical roles, ensure your data is no older than 90 days. When reviewing benchmarks, be methodical: record the date, the filters you applied (like location, industry, or company size), and the sources you referenced. This level of detail will make future updates smoother and more accurate.
Conclusion
By following these steps, you now have a clear framework to assess and fine-tune your salary. Salary benchmarking shifts compensation conversations from guesswork to data-backed discussions. Instead of asking, "What do we think this role is worth?" you can confidently ask, "What does the market pay for these skills and responsibilities?". This approach equips you with the clarity to negotiate effectively and chart your career path with purpose.
But the work doesn’t stop once you’ve set your salary benchmarks. In dynamic industries, compensation trends can change quickly - sometimes within months - making regular reviews essential to ensure your earnings stay competitive. Knowing whether you’re in the 25th, 50th, or 75th percentile can guide your next steps, whether that’s acquiring new skills, seeking promotions, or exploring new opportunities.
It’s also important to look beyond base salary. Bonuses, equity, and benefits play a huge role in shaping your overall financial picture. Tools like Monefy can help you track these elements over time, giving you a complete view of how your total compensation stacks up against market benchmarks and aligns with your personal goals.
Armed with solid data, you can make smarter decisions - whether it’s negotiating for a raise, pursuing a new role, or investing in skills that elevate your earning potential. This process isn’t just about earning more; it’s about ensuring your compensation reflects your true value and supports your long-term financial aspirations.
Questions? Answers.
How often should I benchmark my salary?
Most professionals should review their salary at least once a year, ideally around performance reviews or at the start of the year. However, if you’re in a fast-evolving field like tech or digital marketing, quarterly reviews might be better. Salaries in these industries can jump 15% to 25% in just a few months, so frequent checks help you stay competitive. For critical or high-demand roles, aim to use market data that’s no older than 90 days.
What's the difference between the 50th and 75th percentile in salary data?
The 50th percentile represents the median salary - half of the professionals in similar roles earn more, while the other half earn less. This is a common target for market-aligned pay. The 75th percentile, on the other hand, represents the higher end of the market, usually reserved for individuals with specialized skills, extensive experience, or those in competitive industries. If you have in-demand expertise or a proven track record, aiming for the 75th percentile can be realistic.
Should I include bonuses and benefits when comparing my salary?
Absolutely. Total compensation goes beyond base pay and includes bonuses, stock options, retirement contributions, health benefits, and other perks. Two jobs with the same base salary could offer vastly different total packages. For example, one might include a 20% annual bonus and equity, while the other offers neither. Always evaluate the full financial package to understand your market value accurately.
What salary data sources are most reliable?
The best approach is to cross-check multiple sources. Employer-verified surveys are accurate but may be slightly outdated (6 to 18 months old). Real-time platforms with HRIS integration offer more current insights, especially for fast-changing markets. Government resources like the Bureau of Labor Statistics provide free, verified data. Self-reported platforms can offer useful trends but may have biases. Relying on at least two or three sources ensures a balanced and accurate perspective.
How do I account for remote work when benchmarking my salary?
Remote work has introduced new pay structures. Some companies use geographic pay zones - like Tier 1 for high-cost areas (e.g., San Francisco, New York) and Tier 3 for lower-cost regions - while others adopt a flat national rate. When benchmarking, consider your specific situation. If your employer uses geographic pay zones, compare your salary to others in your tier. If they pay national rates, use nationwide data. Also, factor in cost-of-living adjustments and whether relocating or working remotely might impact your financial position.